Screen companies
Company information
Name, CVR number, address, industry and legal form are based on the Danish Central Business Register (CVR).
CVR / Virk
The information about Astrup Group A/S combines official Danish company and financial-statement data with indicators calculated by Valuatum Oy.
Name, CVR number, address, industry and legal form are based on the Danish Central Business Register (CVR).
CVR / VirkFinancial figures come from annual reports published through the Danish Business Authority. The latest financial year used is 2024.
Open the 2024 annual reportValuatum Oy calculates financial ratios, comparisons and credit-risk indicators from the available accounts. The results support analysis and do not constitute a standalone credit decision.
Valuatum OyAstrup Group A/S (CVR number: 3106121-0) is a company from RINGKØBING-SKJERN. The company recorded a gross profit of 5533.5 kDKK in 2024. The operating profit was 977.8 kDKK, while net earnings were 33.2 kDKK. The profitability of the company measured by Return on Assets (ROA) was 6.2 %, which can be considered decent but Return on Equity (ROE) was 3.8 %, which can be considered weak. The equity ratio, a key indicator for solidity, stood at 4.8 %, a level that can be considered to be very low. This means the company is highly leveraged, with most assets financed through debt. This high level of financial risk could pose challenges in periods of financial distress or rising interest rates. Astrup Group A/S's liquidity measured by quick ratio was 0.2 which is at a very low level. Thus, the company is in an unstable financial position, with its liquid assets significantly undermatching its current liabilities. This severe liquidity deficiency may lead to financial distress and threaten the company's operational continuity.
2020 | 2021 | 2022 | 2023 | 2024 | |
|---|---|---|---|---|---|
| Volume | |||||
| Net sales | |||||
| Gross profit | 6 979.93 | 6 812.09 | 4 215.23 | 6 728.36 | 5 533.49 |
| EBIT | 1 705.58 | 1 169.86 | -1 679.68 | 2 630.64 | 977.85 |
| Net earnings | 818.00 | 371.67 | -2 550.51 | 1 674.60 | 33.17 |
| Shareholders equity total | 1 451.83 | 1 756.51 | - 794.00 | 880.59 | 859.71 |
| Balance sheet total (assets) | 14 715.90 | 21 347.22 | 18 088.87 | 16 257.14 | 17 814.24 |
| Net debt | 10 577.91 | 17 732.15 | 17 521.13 | 12 938.26 | 15 227.85 |
| Profitability | |||||
| EBIT-% | |||||
| ROA | 13.1 % | 6.8 % | -8.1 % | 15.2 % | 6.2 % |
| ROE | 81.0 % | 23.2 % | -25.7 % | 17.7 % | 3.8 % |
| ROI | 15.1 % | 7.7 % | -8.7 % | 17.0 % | 7.1 % |
| Economic value added (EVA) | 832.56 | 249.31 | -2 574.23 | 1 935.92 | -0.90 |
| Solvency | |||||
| Equity ratio | 11.0 % | 8.3 % | -4.2 % | 5.4 % | 4.8 % |
| Gearing | 731.2 % | 1 010.7 % | -2 210.1 % | 1 471.0 % | 1 773.0 % |
| Relative net indebtedness % | |||||
| Liquidity | |||||
| Quick ratio | 0.3 | 0.1 | 0.1 | 0.2 | 0.2 |
| Current ratio | 1.0 | 1.0 | 0.9 | 1.0 | 1.0 |
| Cash and cash equivalents | 38.03 | 21.02 | 26.89 | 15.42 | 14.52 |
| Capital use efficiency | |||||
| Trade debtors turnover (days) | |||||
| Net working capital % |


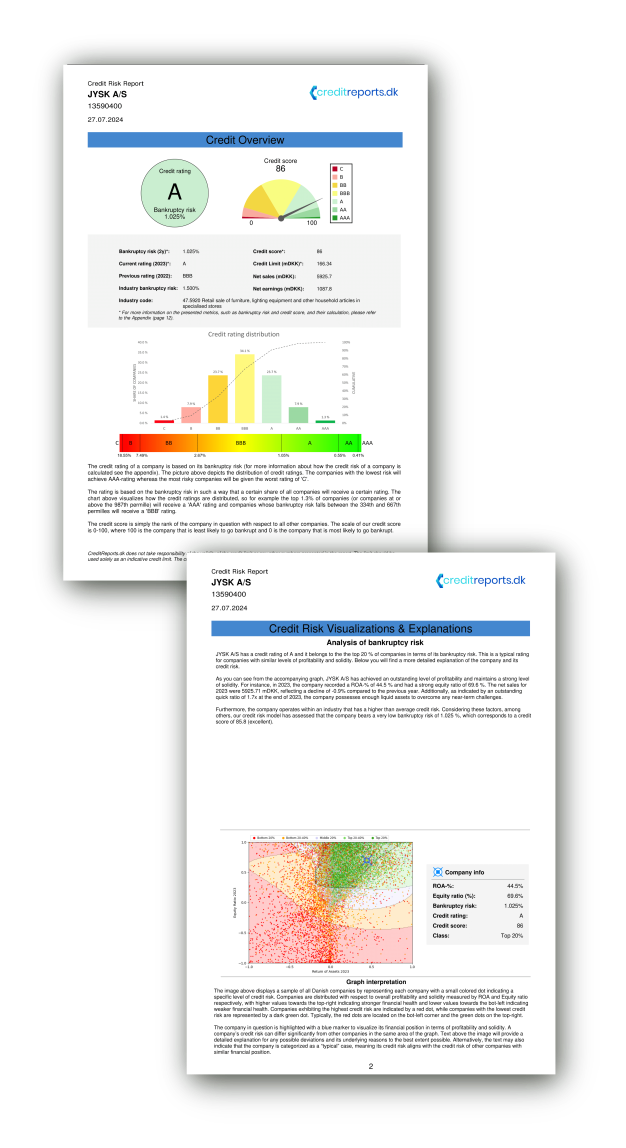
Check the creditworthiness of Astrup Group A/S before offering payment terms. The report combines financial figures, risk scores, credit rating, bankruptcy risk and a credit-limit recommendation in one PDF.
Automatic monthly billing is under development. The feature is not yet active in our system, but it is coming soon. You get access to the service immediately after registration, while billing is handled manually by email invoice for now.
By pressing the button below, you confirm that you have read the terms above and allow us to invoice you 20 EUR / month.
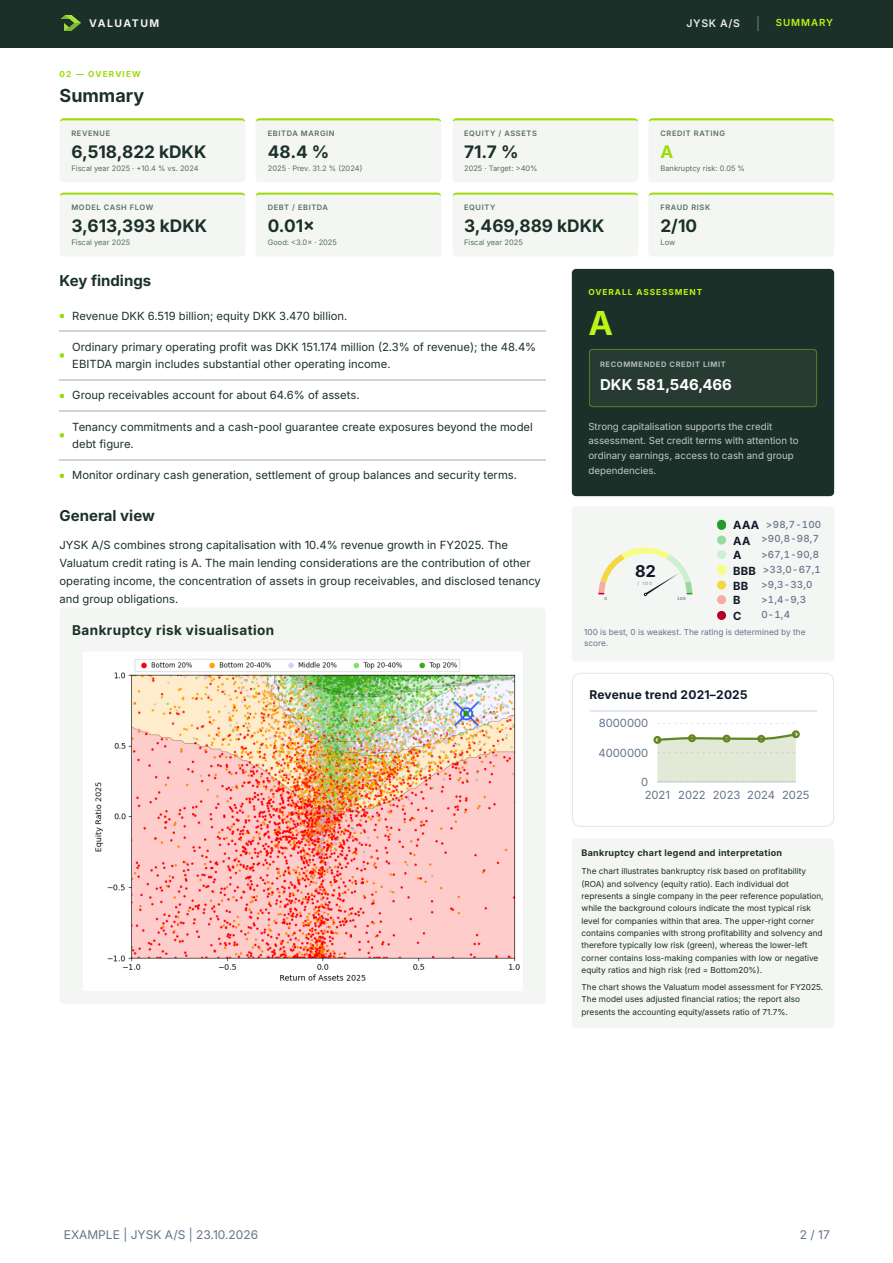
The AI Credit Risk Report contains the same core financial figures and risk measures as the Credit Risk Report. It also provides written analysis of the company's finances, risks, repayment capacity and assets, together with relevant context from web searches.
Company-specific, AI-assisted credit risk report in PDF format.
Reports can be tailored to your own credit process: content structure, peer groups, risk thresholds, delivery method and AI-analysis weightings can all be adapted to your needs.
Ask about a tailored solution: contact@creditreports.dk
The report is intended for an initial financial assessment. · The final credit decision and any further verification are always the user's responsibility. · One-time payment, no subscription.
Pay by card and the report is generated automatically and sent to your email. One-time payment – no subscription.
The report is sent to the email address you enter in Stripe's payment window. Please also check your spam folder. Questions? Write to info@creditreports.dk.